
Zero Trust vs. SASE: Everything You Need to Know
Zero Trust vs. SASE: Everything You Need to Know Introduction As the cyber world continues to change, companies need to look beyond conventional security
Zero Trust vs. SASE: Everything You Need to Know Introduction As the cyber world continues to change, companies need to look beyond conventional security

Cloud Security Posture Management (CSPM) Introduction In the era of digital transformation, organizations are moving to the cloud at an unprecedented pace. While the

How to Strengthen Security Using CIS Controls and Posture Analysis Introduction In the fast-paced and ever-evolving world of cybersecurity, defending digital infrastructure goes far
Table of Contents
In today’s data-driven world, businesses are constantly seeking tools that can help them make sense of the vast amounts of information at their disposal. Enter Power BI Desktop, a powerful business analytics tool by Microsoft that empowers users to visualize and analyze data with ease. In this blog, we’ll delve into what Power BI Desktop is, its key features, how it works, and why it’s become a staple for data professionals worldwide.
Dive deeper into the world of cloud technology and IT mastery with IPSpecialist! Get the best course by accessing comprehensive IT certification training and resources. From beginner-level IT courses to mastering Cloud Computing, Cybersecurity, DevOps, Microsoft, and more, IPSpecialist offers diverse courses, study guides, and practice exams tailored to amplify your skills.
Power BI Desktop stands as a cornerstone within the Microsoft Power BI suite, offering robust features tailored for data analysis and visualization. As a free standalone application, Power BI Desktop provides users with a comprehensive toolkit to transform raw data into compelling insights and actionable reports. Let’s delve deeper into its functionalities and significance within the broader Power BI ecosystem.

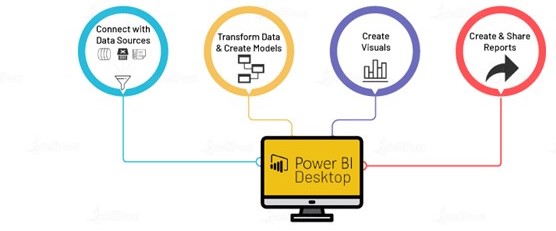
Power BI Desktop follows a straightforward workflow that allows users to create insightful reports in a few simple steps:
Power BI Desktop stands out as a formidable tool for data professionals and analysts due to its comprehensive feature set and intuitive interface. Let’s delve deeper into each of its core functionalities:
Power BI Desktop offers unparalleled versatility in data connectivity, allowing users to seamlessly connect to a wide range of data sources. Whether it’s Excel spreadsheets, SQL databases, cloud services like Azure and Google Analytics, or even web pages, Power BI Desktop ensures that users can access and integrate data from disparate sources with ease.
This broad connectivity empowers users to leverage data from various platforms and sources, facilitating comprehensive analysis and insights generation.
A standout feature of Power BI Desktop is its robust data modeling capabilities, which enable users to create unified data models from multiple data tables. Users can establish relationships between these tables, ensuring seamless integration and cohesive analysis.
Additionally, Power BI Desktop supports advanced data shaping and transformation functions through its intuitive Power Query Editor. Users can clean, transform, and enrich their data before analysis, ensuring data quality and consistency.
The ability to shape and model data according to specific requirements lays the foundation for accurate analysis and insightful reporting.
Power BI Desktop offers a rich library of customizable visualizations that enable users to effortlessly create visually stunning and interactive reports. Power BI Desktop caters to diverse analytical needs, from traditional bar charts and line graphs to more complex visualizations like heatmaps and tree maps.
Users can customize every aspect of their visualizations, including colors, fonts, labels, and axes, to tailor reports to their specific requirements. This flexibility ensures that reports are not only informative but also visually appealing and engaging.
Power BI Desktop empowers users to design visually stunning and interactive reports with ease. The application offers a rich library of customizable visualizations, including bar charts, line graphs, pie charts, maps, and more. Users can customize every aspect of their visualizations, from colors and fonts to labels and axes, to suit their specific requirements.
Additionally, Power BI Desktop provides a flexible canvas for arranging visualizations, enabling users to create compelling data stories that convey insights effectively.
DAX serves as the formula language within Power BI Desktop, empowering users to perform complex calculations and data manipulation within their reports. Whether it’s aggregating data, calculating growth rates, or applying conditional logic, DAX provides the flexibility and functionality needed for advanced analysis.
With DAX, users can create calculated columns, measures, and calculated tables, allowing for dynamic and interactive reporting that drives informed decision-making.
Power Query Editor is an integral part of Power BI Desktop that facilitates data transformation and cleansing tasks. Users can utilize Power Query to perform a wide range of tasks, including filtering, merging, and shaping data before loading it into the data model.
The intuitive interface and extensive set of transformations offered by Power Query Editor make it easy for users to prepare their data for analysis, ensuring that only clean and relevant data is used for reporting purposes.
While Power BI Desktop serves as the primary tool for building reports and conducting analysis, it seamlessly integrates with the Power BI service for sharing, collaboration, and distribution. Users can publish their reports to the Power BI service, where stakeholders can access, share, and consume them.
Power BI Desktop also supports seamless synchronization with the Power BI service, ensuring that reports remain up-to-date with the latest data without manual intervention.
There are three views available in Power BI Desktop, which you select on the left side of the canvas. The views, shown in the order they appear, are as follows:
Power Query is the data transformation and mash-up the engine. It enables you to discover, connect, combine, and refine data sources to meet your analysis needs. It can be downloaded as an add-in for Excel or can be used as part of the Power BI Desktop.
Power Pivot is a data modeling technique that lets you create data models, establish relationships, and create calculations. It uses Data Analysis Expression (DAX) language to model simple and complex data.
Power View is a technology that is available in Excel, Sharepoint, SQL Server, and Power BI. It lets you create interactive charts, graphs, maps, and other visuals that bring your data to life. It can connect to data sources and filter data for each data visualization element or the entire report.
Microsoft’s Power Map for Excel and Power BI is a 3-D data visualization tool that lets you map your data and plot more than a million rows of data visually on Bing maps in 3-D format from an Excel table or Data Model in Excel. Power Map works with Bing maps to get the best visualization based on information on latitude, longitude, or country, state, city, and street address.
Power BI Desktop is a development tool for Power Query, Power Pivot, and Power View. With Power BI Desktop, you have everything under the same solution, and it is easier to develop BI and data analysis experience.
The Q&A feature in Power BI lets you explore your data in your own words. Using natural language is the fastest way to get an answer from your data. An example could be what was the total sales last year? Once you’ve built your data model and deployed that into the Power BI website, then you can ask questions and get answers quickly.
Business users may see and interact with reports and dashboards published on a cloud service through mobile-hosted Power BI instances. Power BI mobile apps are available for Android, Windows, and iOS devices.
The Data Catalog option allows you to search for and reuse queries.
This component handles periodic data refreshes, data feed viewing, and table exposing.
Power BI Desktop has emerged as a leading choice for businesses seeking to harness the power of their data to drive informed decision-making. With its robust features, intuitive interface, and seamless integration with the Microsoft ecosystem, Power BI Desktop empowers users to transform raw data into actionable insights. Whether you’re a data analyst, business user, or IT professional, Power BI Desktop provides the tools you need to unlock the full potential of your data and drive business success.
Yes, Power BI Desktop is a free application provided by Microsoft. Users can download and use it without any cost. However, certain features like collaboration and sharing capabilities may require a Power BI Pro subscription.
Yes, Power BI Desktop is capable of handling large volumes of data. Its in-memory processing engine ensures fast performance, even when working with massive datasets. Additionally, Power BI Desktop supports data compression and optimization techniques to enhance performance.
While Power BI Desktop offers advanced functionalities such as DAX (Data Analysis Expressions) for complex calculations, users do not necessarily need programming skills to use the tool effectively. The interface is designed to be user-friendly, and many tasks can be accomplished using drag-and-drop functionality and intuitive wizards. However, familiarity with basic data modeling and analysis concepts can be beneficial for maximizing the tool’s potential.